Loading cart contents...
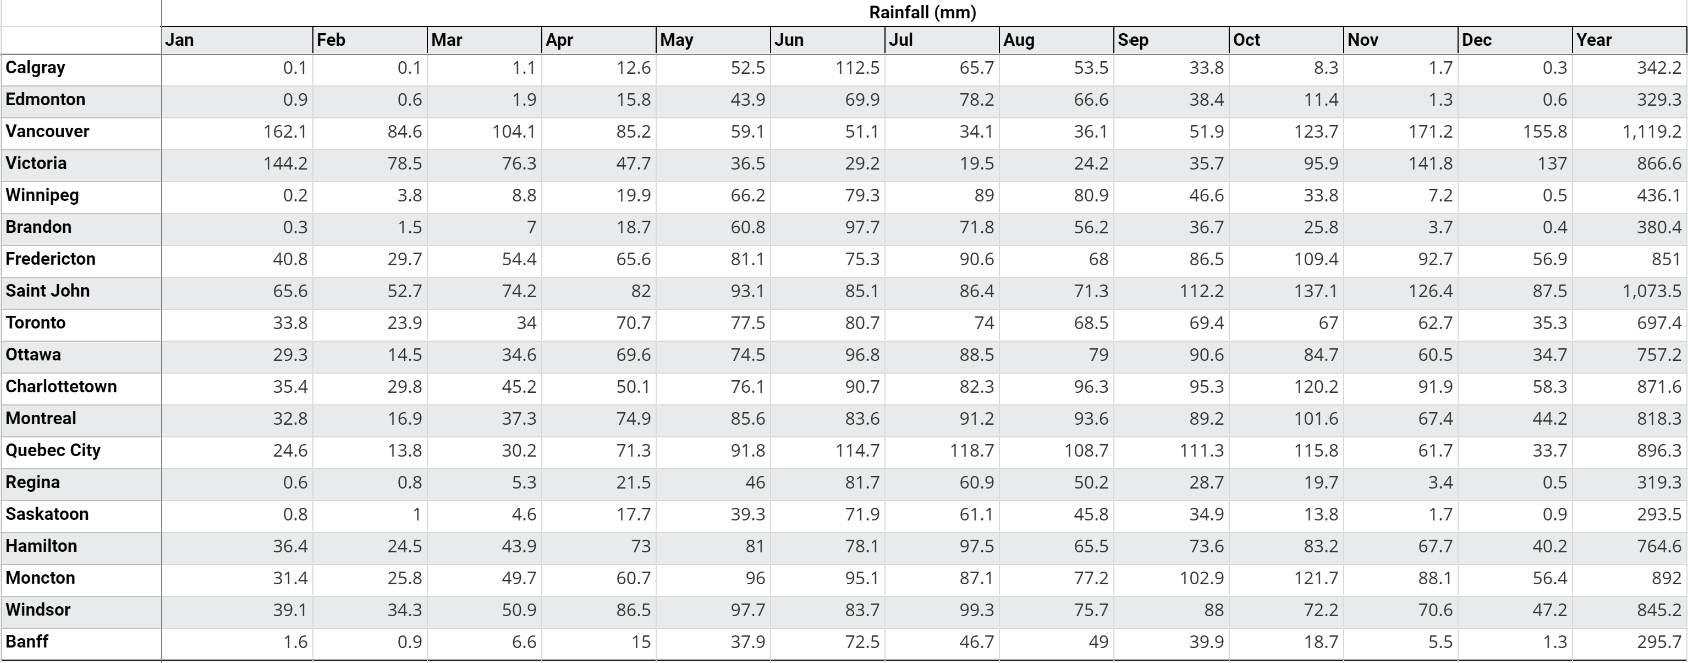
The chart provided illustrates the average annual rainfall for various locations from 1991 to 2020. Please note that this data set does not encompass all cities and towns across Canada. If your area is not represented in the chart, you may refer to the Canadian Climate Normals for additional statistics. To access this data, search for your specific location, click on the “Normals Data” tab in the top row, and then scroll down to the precipitation section to view the relevant information. Use this data in the equation below to figure out how much rainwater your catchment area can provide.


